Wednesday, August 24, 2011
Words I found today
churlish - Rude in a mean-spirited and surly way
Tuesday, August 23, 2011
SP500 Price, Value, ahhhh! The CNBC Talking Heads are going to make my brain explode
A Wall Street strategist once said that when he walks into a financial services firm and they have a television programmed to CNBC, it's the same as walking into a hospital and they have their TV programmed to General Hospital. That is, it's laughable that doctors would learn anything from General Hospital and thus, it's laughable that any one worth their salt in finance can learn anything from the talking heads on business television.
The past few weeks have seen large gyrations in the stock market. I have seen friends and colleagues, the same who haven't looked at their 401Ks since the last crisis, frantically trying to log in to their plans website. The heads on CNBC are running about with their hair on fire, trying to claim the crown of most-over-the-top. The more the heads screamed the more my friends tried logging into their account. The friends told me the websites to change their allocations were down for days. ( An ancillary point, is that besides doing the minimum to garner the company match and then only plugging those funds into the cheapest bond fund offered, is insane.)
Imagine if CNBC had a sane talking head who did a quick analysis like above and said "Meh, prices looked elevated. I took this opportunity to sell some of my holdings and will wait for the prices to drop. The further prices drop the more earnings I get. This is akin to waiting to buy a 60" LCD televisions set after the Super Bowl (when prices drop) versus buying a 50" set before." The important thing to remember is that you are buying earnings; you are not buying a lottery ticket when you purchase stock.
PS~ Alternatively, if the news picks up and the index pierces the EMA I would take a short time frame position in SPX, but not rotate out of my over-weighted gold allocation
Sunday, June 27, 2010
Friday, May 14, 2010
Greece viewed thru an American lens
I could not really grasp how the country was such a hot mess. When asked by co-workers what the whole debacle was about I had a faint idea and feinted more than I knew. I knew Paul Krugman said they had a primary deficit. I merely nodded my head in agreement. Then headed off to the inter-tubes for some research.
Wikipedia states that a primary deficit is the pure deficit which is derived after deducting the interest payments component from the total deficit of any budget. Now I understand what the words mean but to a get a true understanding of I needed to dig into the data, play with it and return it back in my own words. However, there are two things at play with what comes next, a) I don't have as much access as I did in my graduate studies to robust data that would give me the information that Paul used to make his assertion and b) it would be far easier to look at the US data and it would be more meaningful to what I deem a US-centric audience.
I do not want to stray to far from the topic but this ancillary topic is important and probably deserves a post of its own. The deficit is the debt incurred in a single year and the national debt is all the debt accumulated over the past years that has not been paid off. When the debt comes due the Treasury, if there is not a surplus, will pay off the previous holders of the Treasury securities with new bond offerings. The cash received from the new offerings will pay the interest and principal on the old debt that is retiring. The structure of this debt is very important. As a country becomes increasingly risky it will find that it has to issue debt in shorter durations to achieve an acceptable funding rate because investors, here and abroad, will not want to take on a longer dated debt obligation due to the increasing risk of non-payment, i.e. default.
www.cbo.gov/budget/data/historical.pdf

Here is a historical chart. If you have eagle eyes you can see that we have been in a surplus in 5 of the 40 years that the chart covers. This chart does come with a caveat that you are looking at nominal holdings and thus inflation would erode some of the levity that this chart imbues.

Above is the average maturity of the United States debt as it has evolved over time and how it projects in the future. The Treasury is taking advantage of the need for US Securities by bringing back the 30 year bond and extending the maturity so that there will be less likely of a situation where there is need for short term issuance to pay interest payments. This is where the US and Greece diverge. Greece has its two year debt pre-bailout trading anywhere from 12-20% payments based upon the principal you would pay to get the coupons. The US is faced with the opposite, our rates are so low that we are extending out the maturity schedule to take advantage of the historically low rates.
Is the difference only a temporal one? No, Greece also has a structural deficit besides the primary deficit highlighted above. So think back to the total deficit above and ignore the primary deficit. The structural deficit is the portion of the debt that always exists because of expenses undertaken that it must pay either voluntarily or at its discretion, think social security versus military spending. Another way to view the structural deficit is via the business cycle. For simplicity, we hypothesize that there are only two states boom or bust. In boom there is low unemployment and tax revenues are growing. In the bust it is the opposite there is a high unemployment and tax revenues are declining. In the second status the deficit will grow because the government will be paying out the same amount of services but revenues will be down, hopefully though, the government planned for the rainy day and used it surplus in the boom to not only keep up the same amount of services but also to extend services that will need expansion during a recession. The biggest expenditure that needs expansion is unemployment insurance.
Let us next look at the latest information.

What we are looking at here is the entire budget (revenues and expenses) encompassed in the large circle. By accounting convention the three pie pieces must equal. We have in order the Revenues in yellow, the expenses in blue and the deficit in red. The deficit must be balanced by borrowing in the capital market. The funding for the deficit is received form both US investors and those from abroad.
We break out the revenues by source to glean insight into how our federal government funds itself. The key categories are in order: income taxes (45%), social security and payroll tax (40%), corporation income tax (9%) and other (3%.) It becomes quite obvious that the taxpayer is the major supplier of all the revenues of the Federal government. What is quite amusing is that when viewed through a political lens one always hears about the gift tax or the estate tax. Now, both of those when added together equal 84 basis points of the Federal government's income or 0.84% for the lay person. Thus, anyone pontificating about that should explain why that particular issue is more pressing than payroll taxes or income taxes.

This chart is slightly different in that revenues and expenses are reversed. So it goes expenses in blue, revenues in yellow and deficit in red. There is continued color coding in the breakout. With the bright red being the mandatory spending in a particular year, the black being the interest paid out (mandatory,) and then the bright yellow being the discretionary spending. I'll just list the categories and spending percentages:
| Social Security | $695 | 19.57% |
| Medicare | $453 | 12.75% |
| Medicaid | $290 | 8.16% |
| Potential Disaster | $11 | 0.31% |
| Other Mandatory Prog's | $571 | 16.08% |
| Interest on Debt | $164 | 4.62% |
| Defense | $663.70 | 18.69% |
| Govt Svc Programs | $704.10 | 19.82% |
So the key for the US will be the mandatory programs (SS, Mc, Ma, PD, Other and Interest on Debt) versus the income received. Bluntly stated $2,380 income versus $2,184 mandatory expenditures.
Is there one easy cut in this list? Obviously, the interest on debt is above all others. SS, and the Medicare/Medicaid funds are a no-no. You cannot cut defense in a recession unless you wish the unemployment rate to increase further. However, there must be some fat in the Government Services programs; waste, fraud, incompetence, etc. Below is the department, the spending and the percentage of the total ($704.10.)
| Health & Human Svcs | $78.70 | 11.18% |
| Transportation | $72.50 | 10.30% |
| Veterans Affairs | $52.50 | 7.46% |
| State | $51.70 | 7.34% |
| Housing | $47.50 | 6.75% |
| Education | $46.70 | 6.63% |
| Homeland | $42.70 | 6.06% |
| Energy | $26.30 | 3.74% |
| Agriculture | $26.00 | 3.69% |
| Justice | $23.90 | 3.39% |
| NASA | $18.70 | 2.66% |
| Commerce | $13.80 | 1.96% |
| Labor | $13.30 | 1.89% |
| Treasury | $13.30 | 1.89% |
| Interior | $12.00 | 1.70% |
| EPA | $10.50 | 1.49% |
| SSA | $9.70 | 1.38% |
| NSF | $7.00 | 0.99% |
| Corps of Eng | $5.10 | 0.72% |
| NIB | $5.00 | 0.71% |
| Ntl & Comm Svcs | $1.10 | 0.16% |
| SBA | $0.70 | 0.10% |
| GSA | $0.60 | 0.09% |
| Other Agencies | $19.80 | 2.81% |
| Other | $105.00 | 14.91% |
Here are some poll results from a YouGov/Economist poll of what and where to cut.
26. If government spending is reduced in order to balance the budget, which of the following government programs should receive lower federal funding than they currently do? (Please check all that apply.)
Social Security ..............................................................7%
National Defense ........................................................ 22%
Medicare ....................................................................... 7%
Aid to the Poor .............................................................17%
Medicaid ..................................................................... 11%
Veterans’ Benefits ........................................................6%
Health research ...........................................................13%
Education ................................................................... 12%
Highways ....................................................................12%
MassTransit ................................................................27%
Foreign Aid .................................................................71%
Unemployment benefits ............................................19%
Science and Technology ............................................22%
Agriculture ..................................................................27%
Housing ......................................................................27%
The Environment ........................................................29%
Maybe it's just a notion that Americans would like to keep all the government programs in place just not pay for them. A phrase Krugman called using Alabama's taxation policy to fund Connecticut's services. The problem is that the expenditures for Social Security, and Medicare and Medicaid are only projected to continue rising. Thus, the structural deficit will only continue to rise. Currently, we are just below the cut off point where the structural deficit is larger than the annual tax income. However, if maintained it plays out like a nationwide game of chicken. It seems that there is an inertia present to maintain the status quo until a disaster occurs and then, and only then, will the entrenched interests' lobbying power be set aside toward popular opinion. One only need look at Katrina, the financial reform act, the oil spill in the Gulf for recent, vivid examples of this terrible game being played out.
It is also the game that Greece must now play as they must make fiscal cuts as a percentage of GDP instead of just a percentage of government receipts just to balance the books.
The above graphs show that the United States is on a path towards what Greece is currently experiencing, however, Greece has arrived at its day of reckoning while the US only faces the prospects if those elected to power or rather those electing politicians to power do not begin to make the tough choices needed.
Sunday, November 1, 2009
Education Serial Malinvestment
When I attended law school at George Washington U in 1969, the tuition was $1,900 a semester. I worked my way through and had no debts when I began to practice law. Later, student loans became the norm. The loans were subsidized, encouraging students to become indebted rather than build sweat equity in themselves. Student loans also took parents off the hook for saving to pay for their childrens’ education. The result was still more government dependency.
Screwing up the marketplace with subsidies, drove up the price of education, encouraged institutions to grow based on government support, and placed undue emphasis (economically) on higher and frequently useless education. We should expect the higher education market to suffer a similar fate to the real estate market, where subsidies, encouraging people to buy what they could not afford (and did not need) led them to a result that, when compared to their investment in time and treasure, was uneconomical.
Eugene Holloway
It seems like a very logical argument, but then I wanted to check what the real price was by inflating via CPI, and also comparing median household income for college graduates in 1969 to today.
He said that it cost 1,900 per semester and the price level has risen 487.52% since them, so in terms today that is $9,262.88. This is 617 dollars per credit hour assuming a full time course load of 15 credits. In my last year in my MBA at a private university the tuition was 1,040 a credit hour so even controlling for inflation the price for a graduate education has risen faster than other prices. [The premium is 68.56%] However, this is only one side of the puzzle, we also need to see what the income level has risen to as well.
With an advance degree the Census shows that in 2000 earned 55,242. The historical data set is not great for tracking down incomes by levels of education. However, in 2000 the median household earned 41,990, so there is a 31.56% premium for the advanced degree. The data set only goes back to 1975 but keeping the same premium when the 1975 median income was 11,800 is $15,524 for an advanced degree. When we inflate the salary so as to make an apples to apples comparison we then find out that the 1975 graduate salary would be $51,705. So there has been an increase in return to attaining a higher degree, but the premium here is 6.84%.
The veil of prices is very tricky. It is easy to allow yourself to look at an old bill and then compare it to one today, but you have fooled yourself since prices of goods and services including most importantly the wage portion of services have increased over time. On this basis, people who have an advanced degree today are better off than those that gained one back in the early 1970s.
Master’s Degree Cost: 64 credits
| | 1975 | 2000 | | | |
| Tuition | 40,488 | 66,560 | | | |
| Salary | 51,705 | 55,242 | | | |
| After tax Monthly Income | 1,702.05 | 1,841.4 | | | |
| Student Loan Cost | 352.69 | 579.81 | | | |
| % of Monthly Income | 20.72% | 31.49% | | | |
As you can see it becomes a little gray as to whether it is a good choice or not. It is a high amount of your disposable income but I also assume that it is paid back in 15 years, whereas these loans can be strecthed to 30 and even 40 years in some cases. It also depends on your cynicism to decide if getting a good job is more like winning a lottery than merit and skills based.
However, this recession might not be the same as previous versions. Salaries might plummet due to the supply of willing labor that hunts for employment. It will be interesting to watch this unfold over the next few years to see if this cohort of graduate students did make a bad economic bargain by going into debt to gain further education.
One of the key teachings that I received during my MBA was from my grouchy advanced finance teacher, by advanced I mean he taught the investment course and the futures & options course. Basically, he called us all idiots. He said and I quote, you make a bargain and you go into debt. You have a certain amount of payments to make at certain times. That's fine. However, you have no idea what your income is going to be. You could have a high-flying job and then get laid off. You may never attain the MBA salary, but it does not matter you still have that debt. The debt does not care and you have to pay it each month. The key is to keep your debt as low as possible so that when fate invariably intervenes with your income statement you can still make those payments until better economic times come back.
On to the model.
Here is the basic supply and demand curve shown along the price and quantity axis.
The government hopes by subsidizing the student loan market, which is a noble cause because having a better educated workforce not only makes for a better electorate but also is one of the only way that advanced economies can continue growth, will increase the supply of schools offering education.
However,
What we are seeing is an inducement for people to take on more education and the price rising. (This is not scaled at all, just showing the move.) So more students are getting degrees but Harvard can only hand out so many a year, thus, the cost must rise.
In truth what is happening is a little of both. Anectdotal evidence when I was obtaining my undergraduate degree at the University of Florida, the only "real" choices in the state was there or Florida State (that is if you did not get into Florida). Now, however, there are comparable educations offered at Central Florida, South Florida, there is a new university in Southwest Florida. So the state system has expanded to accept more students but prices have still risen. So the way I see it, I would model it like this...
How do I know this is correct? Here is the student population for each year of undergraduates and graduates.

You can see that even though prices have gone up by about roughly 60% the undergraduate population has grown by 238.36% and the population of the graduate students has risen 322.46%. Except for the total US population has grown over time as well, so we would need to control for that as well.
So the number belie Mr Holloway's argument and augment mine. Yes, prices have risen but the median salary for college educated workers has risen as well. The population is better off than it was before. The aggregate numbers of students has grown almost 3x as much the price difference meaning that higher learning schools are responding to the inducement to take on more students via financial aid, but it also shows that the demand is rising as well because of the government's program.
As I stated above and in other posts there are only a few "things" in an economy that can improve GDP and the standard of living for a country. For advanced countries there are even less because they will have already exhausted some of their natural resources and fully employed their labor. The last main way to better itself is through technology inlcuding the advancement of knowledge to have a better trained work force that is more productive.
While any program can invariably be run better; the Federal Student loan program has been a success on the whole for students have made use of it.
Thursday, October 29, 2009
A Gold Idea
Source Tudor ManagementThis is a chart that shows the market cap of gold in relation to the global money supply [blue](proxied by M2 of the G-20) and the US money supply [orange.] So relatively the metal is still cheap, even despite it's recent run up.

I took a long position in it in mid-December 2008 and feel it will be a good hedge until we (the market) can determine the austerity of the monetary/fiscal/political regimes in place around the globe. For a quick example of my dire view of the regimes here is David Rosenberg commenting on the US,
CASH FOR CLUNKERS CLUNKED
The government thought it could buy some time with this gimmick but of the 690,000 units that got sold, only 125,000 or less than 20% were truly incremental buying (according to Edmunds.com). In other word, the payback on future sales performance is going to be significant. Instead of wasting time and money trying to prevent households from kicking the spending and borrowing habit, shouldn’t the government be concentrating on helping the population save for retirement; helping the youth solve this 20%+ unemployment rate; finding ways in the fiscal system to promote growth in the capital stock, and improve skills and productivity enhancement?
That fact that equity markets are anal over whether an $8,000 tax credit for first-time buyers is extended or not should not be the focus of policymakers because this subsidy does not address the real fundamental problems in the economy, which is a defunct credit system, a jobs crisis, an massive overhang of vacant homes, apartments, shopping malls and office buildings — not to mention an economy that is becoming dangerously addicted to government
stimulus. As an example of what the government can do without adding further to what is already a burdensome debt load is to reverse the dramatic downtrend in skilled-worker immigration flows (have a look at the front page of the WSJ — slump Sinks Visa Program). Part of the problem — “the anti-immigrant tide in Washington.”
We see on page 2 of the FT, that the Obama team is now contemplating tax credits for new jobs created by companies — a gimmick that Jimmy Carter tried in the late 1970s (if we recall, two recessions followed quickly thereafter). But are companies really lacking in cash right now? Is that why they are not hiring, or is it a subdued and generally uncertain economic outlook? Or the fact that bank credit is contracting at a 15% annual rate and impairing the small business
sector’s ability to secure working capital. Or maybe domestic demand is just plain soft, notwithstanding a brief Q3 bump. A company may well use a tax credit from Uncle Sam to hire a worker, but if business is slow, what is the new worker going to do? File papers? Clip booklets? How does that add to productivity growth? The country needs a job and skills strategy for the future and here we have politicians still pulling out tired gimmicks from failed
presidencies. No wonder confidence is as low as it is.
We may seem overly critical, but if all this fiscal short-termism is what we can expect out of the Washington economic brain trust, then the prospect for a durable economic recovery and the transition to the next sustainable expansion will prove even more elusive than we currently think. The deficit is already 10% of GDP and government debt as a share of GDP is quickly approaching the 100% milestone. The budget plan for the future, at this point, has to be
carefully thought out because we are running out of fiscal bullets.
A Good idea
This particular section though, was pretty spot on in regards to securitization.
Credit Risk Retention
Source
Wednesday, October 28, 2009
Correlation, correlation but where art thou causation

This chart is produced from a data set kept by Yale and Robert Shiller. It shows the 10 year price earning ratio in a scatter chart plotted against the actual 10 year return.
It looks like it could be follow a logarithmic or power law function, and is definitely not linear.
However, we can see that as the PE level is lower the returns are higher. So I made another chart just showing the different levels of PE <5,>25. Here it is.

So while each section has a considerable range between its high and low points, you see lower highs and lower lows as you move from left to right. So this Shiller might be on to something.
Currently Mr. Shiller's has us at 19.48, at the market low in March we briefly nuzzled 13.32 so in the 6 month expansion we have seen the multiple increase by 6x!!!
Last chart

So you can see the bubbles like in 1929 and 2000 were all caused by multiple expansion, as they correlate tightly in those periods. However, in more recent times (2003 - 2007) you can see that earnings kept growing while the price of the index rose in accordance [the P/E line is flat while the red index line moves upward] Finally, as I stated above this last move seems to be all about the multiple expansion as opposed to real growth prospects.
I'd be happy to keep up momentum trading for awhile, even after this week's set back but I think we will test the 750 level again before the Great Recession is over.
Life as a Consumer

Yuppie 911 is a darkly amusing side effect of our lives as a consumer.
The Grand Canyon's Royal Arch loop, the National Park Service warns, "has a million ways to get into serious trouble" for those lacking skill and good judgment. One evening the fathers-and-sons team activated their beacon when they ran out of water.
Rescuers, who did not know the nature of the call, could not launch the helicopter until morning. When the rescuers arrived, the group had found a stream and declined help.
That night, they activated the emergency beacon again. This time the Arizona Department of Public Safety helicopter, which has night vision capabilities, launched into emergency mode.
When rescuers found them, the hikers were worried they might become dehydrated because the water they found tasted salty. They declined an evacuation, and the crew left water.
The following morning the group called for help again. This time, according to a park service report, rescuers took them out and cited the leader for "creating a hazardous condition" for the rescue teams.
Just goes to show, that as emergency services become accessible it needs to have consequences just like 911. Prank calls to 911 can result in arrest and fines, therefore it would make sense to apply those same rules and punishments to calls to rescue services. As a benevolent dictator, I would first outlaw the beacons. The emergency service provider cannot speak with the signaler, so there is no way of knowing what the emergency is or how critical the situation is, thus they are inherently dangerous and expensive tools. Then once the service is set up via sat-phones or regular cellular phones let calls for rescues because of "salty water" be faced with fines and repayments of the cost of rescue personnel and equipment.Basically, these signaling devices have removed the fear that you can get into trouble in the wilderness, so that people take risks that they might not take if they did not have the safety device. It is what an economist might call a moral hazard. Another interesting take is called the Tullock effect.
Strategic Non-Foreclosure
Strategic Non-Foreclosure: "
This morning, we discussed Strategic Mortgage Default. This afternoon, let’s look at Strategic Non-Foreclosure.
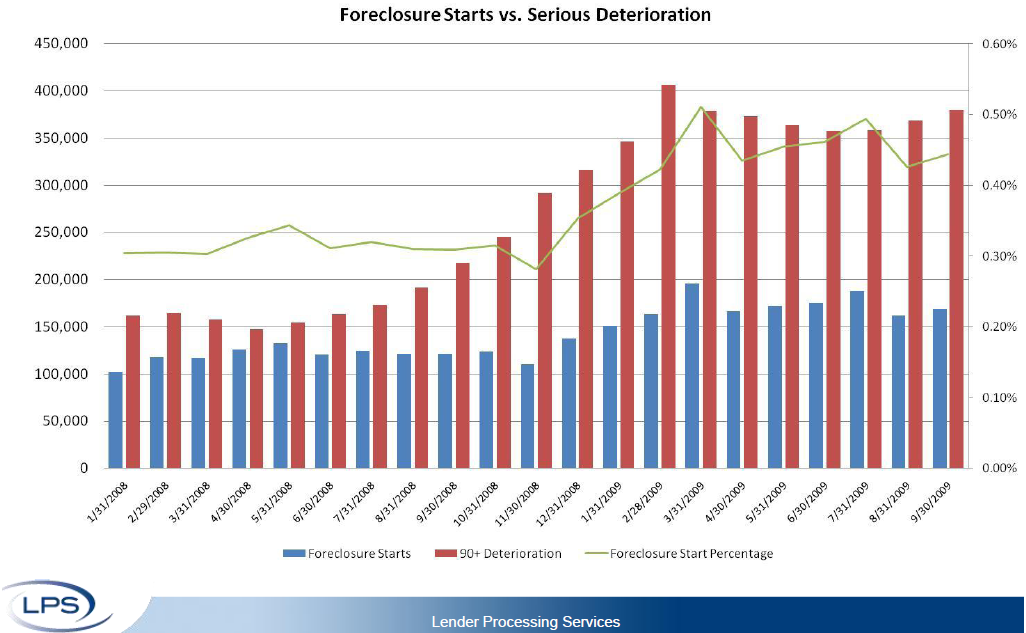
Data via LPS‘ Monthly Mortgage Monitor shows a growing disparity between delinquencies and foreclosure starts. In other words, as more people fall behind on their mortgages, banks are becoming increasingly leery of putting them into foreclosure.
LPS calls this “Shadow Foreclosure Inventory” – The number of loans deteriorating further into delinquent status is more than twice the volume of foreclosure starts.
Why would they wait? Some of it is voluntary foreclosure abatement, some mortgage mod delays. Yet the chart below implies something beyond that. Perhaps its strategic.
Consider: The bank may have other (more expensive?) local properties that would be effected by a foreclosure. They may be waiting for a more advantageous time of year to put the homes up for sale. But I suspect the biggest reason are costs: Until foreclosure, the nominal owner remains liable for all state, real estate and local school taxes. Plus, some localities require regular maintenance (mow yard, clean street, shovel sidewalk, etc.)
Hence, not foreclosing not only gives the owner time to get current, but may also prevent the bank from accruing expenses . . .
Here is LPS chart:
>
click for larger graph
Data as of September 30, 2009 Month-end
>
As Annaly Salvos notes:
“As the graph illustrates, delinquencies are rising, but foreclosure starts are not. As of September 2009, 90+deterioration more than doubled actual foreclosure starts. LPS has dubbed this “shadow foreclosure inventory.” Higher unemployment begets delinquencies and defaults, but foreclosures aren’t flowing through due to modification efforts and various moratoria. Depending on the success of programs like HAMP, more than a few of these loans are still destined for foreclosure.”
Good stuff.
>
Hat tip Scott F!
Sources:
September 2009 Mortgage Performance Observations
LPS Mortgage Monitor, October 15, 2009
http://www.lpsvcs.com/NewsRoom/IndustryData/Documents/10-2009%20Mortgage%20Monitor/LPS%20Mortgage%20Monitor%20Sep09.pdf
Who Knows What Evil Lurks In The Hearts of Men?
Annaly Salvos
October 27th, 2009
http://www.annaly.com/blog/?p=659
Tuesday, October 27, 2009
Serial Inventory Growth (Home Edition)
I just wanted to highlight one section though he sent a 16 pager and it is about a topic that I have been fascinated by, housing inventory.

David presents this as his ultimate rebuff of the NAR's exciting existing home sales report on Monday. Along with this musing "which dragged the months’ supply to 7.8 from 9.3 in July and August and the 11.3 months’ peak in April 2008. This may seem like a great level, but keep in
mind that during more normal market conditions, the average months’ supply is between 4.5 and 5.0 months. However, this could be the calm before the storm as first-time homebuyers rush into the housing market to take advantage of the $8,000 tax credit that is about to expire that the end of November. According to the National Association of Realtors, this is indeed what is happening – “first- time home buyers accounted for more than 45% of home sales during the past year…”
David points out that Census bureau keeps track of year round vacant housing units, which is currently at 3.5 million homes. Additionally, 300,000 homes are being foreclosed on each month. So instead of looking at the drop of month's supply of housing from 9.3 to 7.8, what we really have is 15 months, and growing, supply of homes. Ouch!
Looks like I will be a serial renter for awhile longer.
AD & AS in concert and in dischord
First, we begin with a chart.

This chart shows the Aggregate Demand (AD) curve, the Aggregate Supply (AS) curve and the Long Run Aggregate Supply (LRAS) curve. Currently, it is in equilibrium with the price level at the natural rate of output of the economy. From our previous posts, we know that the AS and AD curves can shift, which will cause short term fluctuations in the economy. Now we can use this model to explore why things happen, like they did in 2007 and 2008.
So let's examine the recent crisis, more closely. In a nutshell, loans were given to bad credit risks with little to no documentation because in the originate to distribute model, the borrower would only need to meet a minimum amount of payments before the loans could be sold to investors. Investors, relying on the advice of credit rating agencies, believed that the securitized pools offered superior returns for the high credit ratings and bought these investments. After, it was revealed that most of these investments were, when the tide rolled out swimming naked. This caused people to stop consuming and start saving as their financial asset portfolio and housing investments were no longer worth as much as was believed. Thus, the chart.

Here you can see that AD curve shifts downward [to the left] to a new equilibrium in the short run but that there is an output gap between what the economy can normally produce. We saw this when looking at the CBO's GDP projections, shown here.

You can picture that the gap between the actual GDP in black and the thinner natural output line is the same in the chart above where it is shown the gap between short run equilibrium and its gap from the darker red line which indicates the natural output of the economy. Eventually, [shown below] the gap will close again just like in the CBO's projections.

Here the output gap is closed by the short term AS curve adjusting to the new pricing paradigm as the veil of prices is lifted. Stated another way, as the costs of goods/services decline workers will not need as great a wage to maintain their standard of living. The workers will then return to work at the new lower wage and capacity in the economy will return to normal.
All of the above assumes that policymakers do nothing. That is, if they followed an Austrian School of Thought, that any policy will invariably make matters worse and instead the free market should be allowed to work to clear prices. Instead, what usually happens, is that policymakers tend to use fiscal and monetary stimulus to stop the process at price equilibrium 2 and return it to price equilibrium 1.

Again, usually, the Federal Reserve will act first to loosen the money supply, which through the financial system will drop interest rates making it more attractive to buy capital goods via financing and will make business opportunities more attractive. If this does not work, then in concert, the fiscal authorities can undertake stimulus by borrowing when the private sector will not, to invest in capital goods. This should have a multiplier effect in that companies hired by the government will then give money to their employees who then spend it on consumption ... until economic growth ensues.
Shifts in Aggregate Supply
This usually comes about in changes in the cost of production to firms. There is some interesting work done by Professor Jim Hamilton in this area with regards to oil and the global economy, a post is here, so we will run with it. In his post, he uses econometrics to describe the global economy and its growth from 2004 to 2008. He shows that the price of oil could have risen to 142 dollars per barrel on fundamentals alone. This cost shock affects many areas of the economy because oil is not only used to transport so many goods around the globe but it literally makes up goods as well.
Some examples, products that contain petroleum that could be affected by oil prices: Antiseptics, Baby strollers, Balloons, Bandages, Cameras, Candles, Clothing, CDs and DVDs, Computers, Crayons, Dentures, Deodorant, Diapers, Food preservatives, Garbage bags, Glue, Hair dryers, Ink, Insecticides, Medical equipment, Nylon rope, Pacemakers, Photographs, Roofing, Shampoo, Shaving cream, Soft contact lenses, Telephones, Toothpaste, Toys, Vitamin capsules. Source: Ohio Petroleum Council
So the tripling of oil prices would shift the AS curve to the left, which is to state that the cost of production is higher at any price level. This causes an output gap and perhaps even more perversely, prices rise. As shown in the chart below.

We can see this in actual practice by looking at a chart from Dr. Hamilton.

Here the natural rate of output is the green dotted line and the back line is the actual. You can see that the professor's model does an accurate job of describing the oil shock and its affect on GDP.
So now what happens. Well a couple of things can happen:
The natural rate of output of the economy could fall permanently, this would shift the dark red LR AS curve to the left to meet the new price point.

Alternatively, the government can stoke AD curve [via the same mechanisms described above] so that the equilibrium rises to the natural rate of output again but at the cost of permanently higher cost of goods/services.

Finally, the sticky wage theory would propose a scenario like this: because the economy is stagnating but at the same time shows inflation, herein called stagflation, the workers will see their cost of living declining and demand higher wages to compensate them. Firms will lose more money as the cost of goods/services (inputs) continue to rise, called the wage-price spiral. Eventually, the under-utilization (output gap) though will cause more workers to be unemployed. Unemployed workers will work for less thus dropping the costs to firms and make it more profitable to produce more goods. Eventually you return to the original price equilibrium 1.
Economic Odds and Ends

I had looked at this earlier with total borrowing but this chart focuses solely on the mortgage market. Here you can see how securitization really takes hold at the end of 2004 through 2006, somewhere in the order of 40% of the market. Since then there was a switch into bank portfolio loans as the securitizations came onto the bank's balance sheets, and finally the current state where the GSEs (Frannie and Ginnie) now make up 90+% of the market.
Good annotated chart from Mish Shedlock

Here you can clearly see the dichotomy of the recessions pre-1982 and post and it is a tale of two eras. Job recoveries have always been a "lagging indicator," but I wonder now if NBER calls the end of the recession too soon [queue conspiracy theorists "Nothing to see here. Move along."] So the recession of the 90's and the twin killings in the 2000's have both had job losses continue into the recovery. We should expect that job losses will continue into 2010 and possible 2011, most likely with an upper limit of over 10.5%, that is on the U-3 number. If you look at the broader unemployment situation ( underemployed, discouraged, part time, etc) we are already nearing the 20% mark.
Serial Solipsism
Caspar Hare would like you to try a thought experiment. Consider that 100,000 people around the world tomorrow will suffer epileptic seizures. "That probably doesn't trouble you tremendously," says Hare, an associate professor in MIT's Department of Linguistics and Philosophy.
Now imagine that one those 100,000 people will be you. "In that case you probably would be troubled," observes Hare, speaking in his office. If this is your reaction, he says, "You regard you own pleasures and pains as being especially significant." Which seems natural, Hare adds. "We have a tendency to think that what we care about is important in and of itself."
Yet this tendency creates an apparent inconsistency. You cannot claim your own well-being is uniquely meaningful, more important than the well-being of others, and expect anyone else to regard that notion as an objective fact, something that could be part of a universally acceptable morality.
How should we reconcile these differing perspectives? In recent decades, many philosophers have dismissed our self-interest as a kind of illusion. Indeed, a major current of contemporary thinking has questioned whether a stable "self" exists at all. "We are not what we believe," the British philosopher Derek Parfit has written. Rather, this view holds, we are nothing more than ever-shifting collections of mental and physiological states, lacking a definite, lasting identity.
The joy of solipsism
Hare has leaped into this philosophical fray with a distinctly different view, which he outlines in his new book, "On Myself, and Other, Less Important Subjects," published this fall by Princeton University Press. The fact that we care so much about ourselves, Hare thinks, tells us something deep about the world: It is correct after all, he believes, to regard our pleasures and pains as uniquely important among all pleasures and pains in the universe.
So if we think our self-interest is singularly significant, we are not being fooled. Instead, the fact that we know ourselves best reinforces our sense of individuality over time; we do have stable identities, and our minds are more than a shifting kaleidoscope of impressions. Our ability to make moral judgments flows from this fact.
On the other hand, Hare asserts, our minds are independent enough from the rest of the world that, when other people state their pleasures and pains are present, we should not regard their statements as true. Instead, Hare writes, we should regard those claims as "false, but rightly so."
In so arguing, Hare is reviving the philosophical concept of solipsism — the notion that one's own self has a special status in the world. More specifically, Hare claims in his book that we exist in a mildly solipsistic state he calls "egocentric presentism." To make sound moral judgments despite this condition, Hare asserts, just takes an act of imagination.
Thus Hare states that of course he would rather that he suffer a hangnail than that someone else's leg be crushed, even knowing the other person's pain would not be present. "For an egocentric presentist," writes Hare, "empathizing with an unfortunate [person] involves imagining that the unfortunate has present experiences."
Other philosophers note that Hare's ideas appear counterintuitive. "The argument seems controversial on the surface because it goes against common sense," says Berit Brogaard, an associate professor of philosophy at the Australian National University and the University of Missouri, St. Louis. "There is something eyebrow-raising about it," says Benj Hellie, an associate professor of philosophy at the University of Toronto.
Hare, however, does not think his own theory is radical. "One way to be a solipsist is to insist that other people don't have inner lives," explains Hare. "Another is that there are no other people. But I'm not saying either of these things. I'm not denying that other people exist, are fully conscious, and have brains and minds like my own."
Is universal morality possible?
For this reason, asserts Hare, solipsism need not lead us down a slippery slope into a world where, say, violence toward others could be tolerated. "Even if we give special significance to our own pleasures and pains," says Hare, "we don't go about ruthlessly trying to maximize our own pleasure and others' pain." He calls that "a crude caricature of human psychology," popularized by the 17th-century English philosopher Thomas Hobbes.
We may be self-centered, Hare argues, but not solely moved by self-interest: "It's certainly possible to think your self-interest is important without thinking it's the most important thing in the world." Still, Brogaard, for one, thinks Hare's ideas "are even more extreme" than Hare believes they are. By accepting that we are solipsistic, she believes, we may sacrifice the idea that there is an objective universal morality.
If so, the modestly solipsistic state Hare describes — in which we are still social and moral creatures — represents a trade-off. We may lose our ability to define an objective moral system. But we do have stable selves that can craft moral judgments. "My book is putting perspectival questions back into the ontology, into our picture of the way the world is," says Hare.
That still leaves the task of squaring our recurring self-interest with the common good, day after day. But that is at least a task for which we can each take responsibility, as distinct selves. "Caspar is pointing to a problem we have to come to terms with," says Hellie.