
I found this chart at Barry Ritholtz serially excellent website The Big Picture and of course it made me think, a lot.
At first I was just watching the categories swell up as people who took on debt they could not really afford just could not make the monthly payments any more. Then, I wondered about people who just stopped paying once they realized that the house was worth less than the mortgage contract they were paying for it.
Then I realized something else, that the categories are a function of time as well. First there are the thirty days late, which eventually leads to 60 days late, then 90+ days late [that plus sign will be key], then into foreclosure and finally real estate owned [bank owned.]
Now, of course, one category does not guarantee a transition to the following category. One could have a medical emergency, need the cash for a surgery and then hover in 30 day late category. However, there should still be an amount of correlation for the categories. As the 30 days late category rises, so too should the 60 day category and 90 day. In fact as the arrows show all categories do show a positive slope.
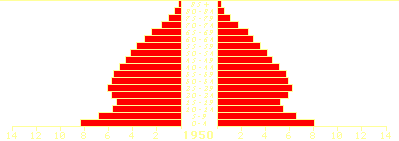
In fact, one should expect to see a pig-in-the-python effect. Look at the graph below, a demographic graph of the United States population, and imagine it on its side.
 For some reason I cannot animate it. Please click here to see the chart move.
Imagine the 30 days late are the baby boomers. You can see the large effect [pig] they have as they move from the head to the rear of the distribution [python.] We should see the same for the mortgages. Not a perfect correlation because as I said above there are ways to save yourself from the foreclosure route. But...
Instead what I see is really a throughput problem. Let's look at the graph again with some new arrows.

As you can now see I simplified to just two arrows, 30 days late and 90+ days late. I discounted the seemingly aberrational June month for 30 days late. I then started the arrow for 90+ days late at a lag of 4 months because obviously these mortgages would pick up only after the initial delay in payment. What is happening is that the 30 and 60 day loans are making it to 90+ days and then sitting there. Slowly, the foreclosure and REO process is picking up but those two steps are slowing the assembly line down.
So the key issue for investors to consider is the plus. If you are going out an looking for a house right now, you must be cognizant that the banks own tons of houses that are in the 90+ day delinquent status and would be foreclosed upon except the banks do not have the manpower or willpower to further the process. Additionally the 30 day late loans are still rising meaning that even more houses have yet to find the pool of 90+ days late. If the house you are looking at has multiple bidders I would walk away, especially if they are bidding with cash.

No comments:
Post a Comment